Age Determination
Methods – Age
1. Purpose
The analytical procedures described here aim to determine the post mortal interval (PMI) of elephants for the purpose of the protection of elephant species. Its development and validation has been described in the final report to the Federal Agency for Nature Conservation (SCHUPFNER 2012). The analytical procedures applied are validated to age representative elephant ivory samples of masses ranging from about 7 g to about 12 g. For this purpose, the values of the specific activity of 14C/C and 90Sr/Ca and 228Th/232Th are determined and compared to calibration curves of the values of PMI as a function of the analyses results.
2. Representative ivory samples
According to Brunnermeier et al. (2012), the sample must be taken from the stump of the elephant tusk to be representative for the purpose of age determination applying the analyses methods to determine the isotope profile of 14C/C and 90Sr/Ca and 228Th/232Th.
3. Analysis procedures to determine the isotopic profile of 14C/C and 90Sr/Ca and 228Th/232Th
3.1 Sample Preparation
When determining the concentration of 14C in the ivory sample, direct absorption and liquid scintillation counting (LSC) can be applied. During this process, the carbon has to be released as carbon dioxide by incineration of ivory. Finally, the carbon is adsorbed to 20 ml through the application of a scintillation cocktail, which serves to detect the concentration of 14C. The scintillation cocktail named OXYSOLVETM is suited very well for this purpose.
If there is a need of analysing 90Sr and/or 228Th/232Th, additional to the determination of 14C/C, the residue of the carbon release should be ashed for about 16 hours in a muffle furnace at a temperature of about 650 °C. After this, the ivory ash has to be moistening with a few mL of nitric acid (65%) and it has to be heated at a laboratory sand-bath at level 4 for a few hours to dryness. Ashing and moistening should be repeated until a snow-white ash remains which is free of carbon and of nitrate as far as possible. The mean value of the ratio of ash to wet weight of ivory has been found to be about (54 ± 5)% (see table 1). At this point, the ivory ash is prepared for combined radiochemical purification and the enrichment with 90Sr and thorium.
3.2 Determination of 14C/C applying direct absorption and liquid scintillation counting
3.2.1 Radiochemical purification and concentration of carbon isotopes (12C, 13C, 14C)
The carbon isotopes (12C, 13C, 14C) which are released by incineration must be transformed into carbon dioxide which is purified from all radionuclides, stable elements or chemical compounds potentially interfering the absorption and the following nuclear detection process. This procedure combining several precipitation steps is described in detail by Brunnermeier et al. (2011) and Brunnermeier (2012).
3.2.2 Detection of 14C applying low-level LSC
14C and all stable carbon isotopes like 12C and 13C which have been released and purified from the ivory sample are absorbed in 20 mL of OXYSOLVETM which is in a PE-LSC-Vial of 20 mL volume. This LSC-cocktail 14CO2 mixture produces flashes which can be detected sensitively by a low-level scintillation counter of type “Quantulus 1220”, produced by LKB Wallac. This scintillation counter combines passive and active shielding to realize both at once; a high counting efficiency of about 73% and low-background counting rates of about 3.1 cpm.
The 13C is corrected. The calibration data, 13C correction and the validation are shown at Brunnermeier (2012). With this analysis, the quality criteria are realized at a counting time of about 2000 minutes. These are shown in table 1 according to Schupfner (2012).
3.3 Combined radiochemical purification of 90Sr/Ca and 228Th/232Th applying Ion-Exchange Chromatography at elevated temperature.
The determination of 90Sr/Ca and 228Th/232Th in elephant ivory can result in a more unambiguous dating of ivory under several conditions which are shown in section 4.2.
The combined radiochemical purification procedure is able to purify, enrich and prepare both for low-level nuclear detection, 90Sr and the thorium isotopes 228Th, 230Th and 232Th. Its basic principle is the application of ion-exchange chromatography at elevated temperature. This method has been firstly developed to purify 90Sr from about 5 to 6 g of ivory ash, and secondly to purify the thorium containing part of the elution solution by applying well suited reversed-phase extraction chromatography. The 90Sr fraction is prepared to be detected with a low-level gas-counter. Therefore, it is precipitated as strontium sulphate at a paper filter of 55 mm diameter. The purified thorium is prepared as a very thin layer by applying electroplating for alpha-spectrometry with silicon semiconductor detectors. These methods are described in detail by Schmied (2012) in the case of 90Sr and Brunnermeier (2012) in the case of the thorium isotopes.
3.4 Nuclear radiation detection methods
3.4.1 Detection of 90Sr applying a low-level-gas counter
90Sr (t1/2 1= (28.90 ± 0.03) years (NNDC 2016)) is a long living beta emitting fission product which decays to the short-living 90Y (t1/2 1= (64.053 ± 0.020) hours (NNDC 2016) to the stable isotope 90Zr.
To detect the high energetic beta-radiations of 90Sr (endpoint energy = (546.0 ± 1.4) keV Browne (1997)) and 90Y (endpoint energy = (2280.1 ± 1.6) keV (Browne 1997) a low-level-gas-flow-counting device, for example a 10-small bowl-low-level-beta counter of type LB 770, produced by Berthold, is suited very well. In order to begin with the counting, 90Y, which has been removed from the sample during the radiochemical purification, is build up according to the lowest level of radioactivity.
During this process, 90Y is about to reach the secular radioactive equilibrium with 90Sr. Therefore, the activities of 90Y and 90Sr are nearly equal during the following counting period. This results in the lowest possible limit of detection with a high counting efficiency of about 66% and low-background counting rates of about 0.5 cpm. At a counting time of about 10000 minutes with this analysis the quality criteria are realized which are shown in table 1 according to Schupfner (2012).
1 t1/2: half life time according to the National Nuclear Data Center Brookhaven National Laboratory, based on ENSDF and on the Nuclear Wallet Cards (NNDC 2016)
3.4.2 Detection of 228Th, 230Th and 232Th applying alpha-spectrometry with Si-detectors
These thorium isotopes are all alpha-emitters from the naturally occurring element thorium. Their half-life times range from (1.9116 ± 0.0016) years (NNDC 2016) for 228Th, (75400 ± 300) years (NNDC 2016) for 230Th and (1.40 ± 0.01) · 1010 years (NNDC 2016) for 232Th. 230Th serves as a nuclide indicating a thorium contamination of the ivory sample. A well known amount of about 0.01 to 0.05 Bq of 229Th with a half-life time of (7932 ± 28) years (NNDC 2016) is added to the sample ash, controlling the chemical losses of thorium during the radiochemical purification process of applying isotope dissolution analyses. All these radionuclide are identified and quantified with a single counting period by applying alpha-spectrometry. Therefore, Si- semiconductors and detectors with high energy resolution are used. The values of the FWHM2 range from about 30 to 50 keV, which also depends on the quality of sample preparation. The alpha-energies are specific for the thorium isotopes and they increase as follows:(4012.3 ± 1.4) keV (Abasaleem 2014) for 232Th, (4687.0 ± 1.5) keV3 (Akovali 1996) for 230Th, (4845.3 ± 1.2) keV3 (Jain et. al 2009) for 229Th and (5423.15 ± 0.22) keV3 (Jain et. al 2009) for 282Th. This results in a very low limit of detection with a high counting efficiency of about 30 to 40% and low-background counting rates of about 0.0001 to 0.01 cpm depending on detector and energy. At a counting time of about 12000 minutes with this analysis the quality criteria are realized which are shown in table 1 according to Schupfner (2012).
3.5 Quality criteria of the determination of the isotope profile of 14C/C and 90Sr/Ca and 228Th/232Th
With the analyses methods shown in sections 3.1 to 3.4 the quality criteria are realized as shown in table 1 according to Schupfner (2012, 2016).
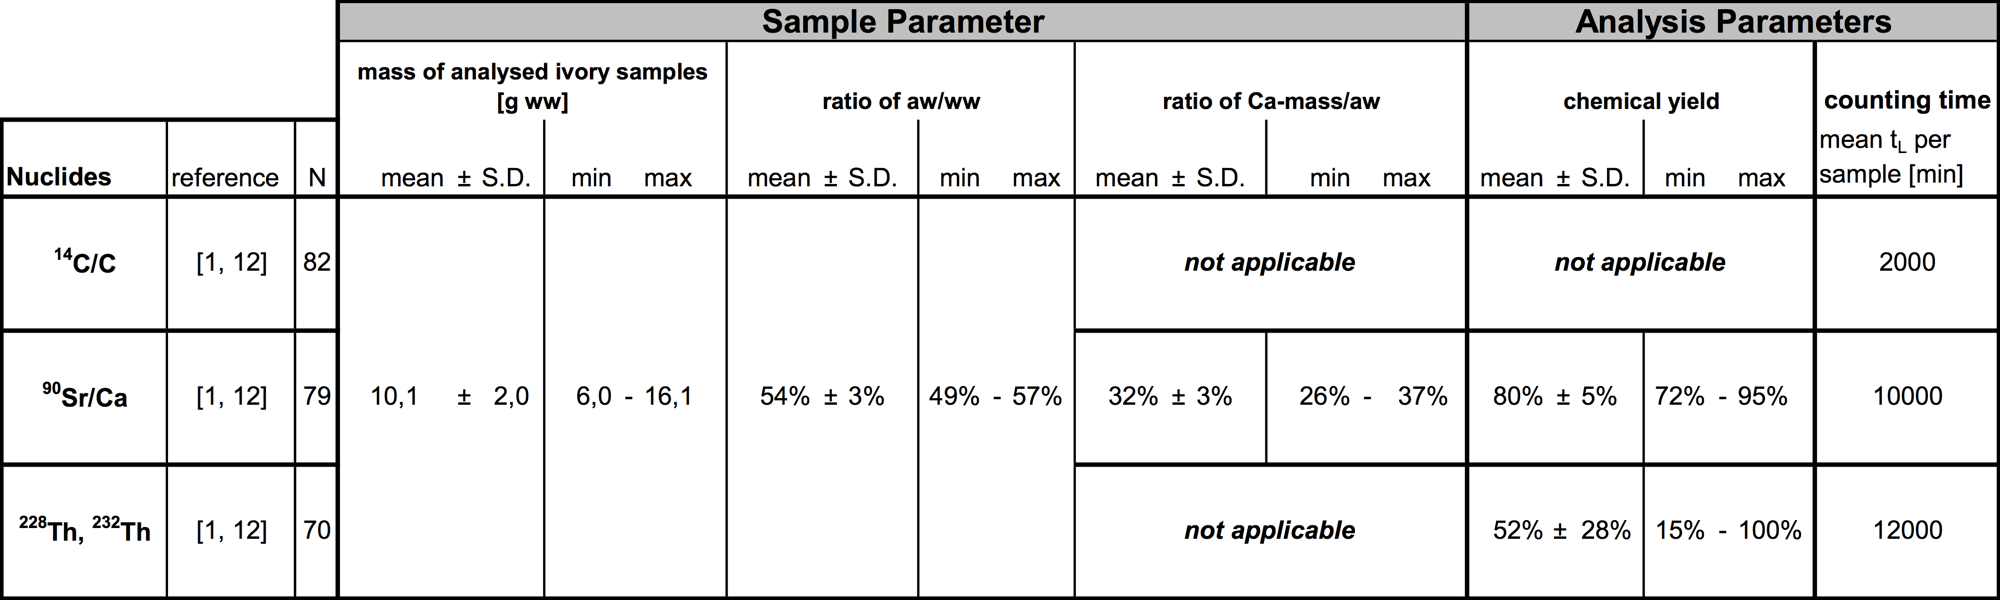
Table 1 a: Characteristic values of sample and analytical parameters according to Schupfner (2012, 2016).
2 FWHM: Full Width at Half Maximum 3 only the energies of the alpha transitions with the highs transition probability is shown here
3.6 Other determination methods
There are a number of other determination methods which are able to determine the isotope profile of 14C/C and 90Sr/Ca and 228Th/232Th as well as the methods described here or even better. In the following section the calculation of the PMI4 does not assume the application of a certain analytical method as described here. It is only assumed that the determination parameters are similar or even more precise than the values shown in table 1b.
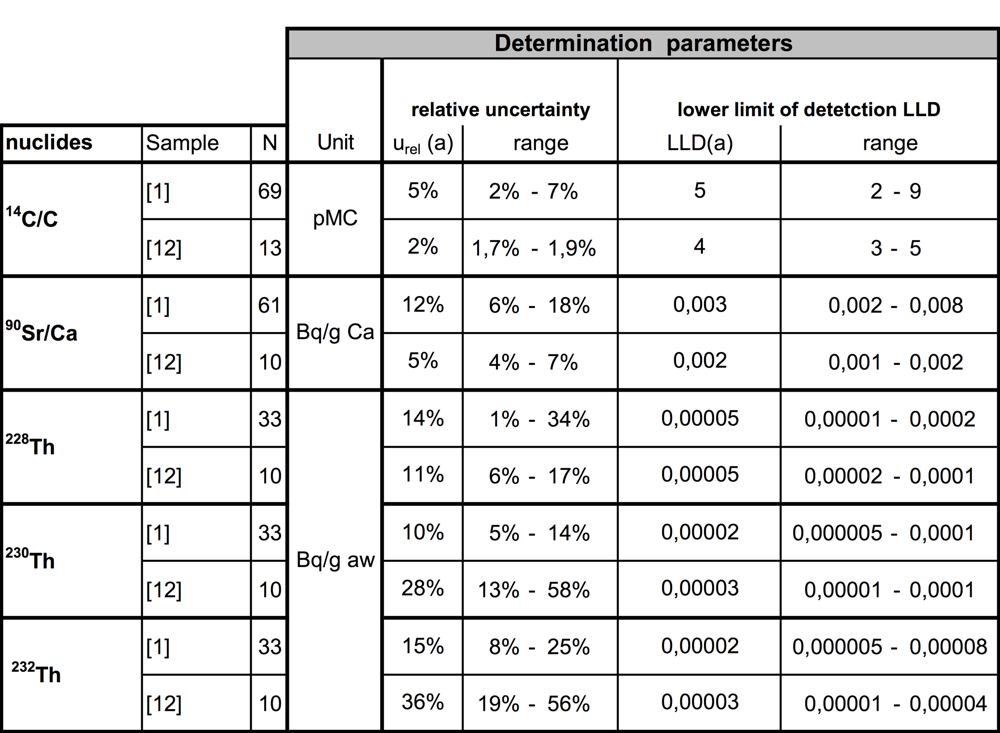
Table 1b: Characteristic values of detection parameters compared with the reference data according to Schupfner (2012, 2016).
4 PMI: Post Mortal Interval: PMI is the period of time from the time of death of the animal whose ivory is analysed to the time at which the detection started
4. Calculation of the PMI5 from data of the isotopic profile of 14C/C and 90Sr/Ca and 228Th/232Th
According to the calibration curves which have been received to analyse independent dated ivory samples the specific activities of 14C/C and 90Sr/Ca as well as the activity ratios of 228Th/232Th the PMI of an elephant can be calculated under certain conditions. The calibration curves are shown in several studies like Schupfner (2012, 2016) which are based on the data published by Brunnermeier et al. (2011, 2012) and by Brunnermeier (2012) and Schmied (2012). All studies found that the values of 14C/C can enable a sufficient unambiguous determination of the PMI, if the analyses results are within a suited range. In the following section, the interpretation and calculation of the PMI as results of the 14C/C determination are shown.
4.1 Calculation of the time of death TD(14C/C)
The results of 14C/C in units of pMC6 are found to be within a range from about 97 pMC to about 109 pMC. The mean value of the relative reference value of the uncertainty urel (14C/C) is about (5 ± 3)% which has been observed during the validation process analysing 69 samples (Schupfner 2012). This is a typical range applying the method of low-level LSC after direct 14CO2 absorption which has been described in section 3.1 and 3.2. Data taken from recently completed studies by Schupfner (2016) and Auerhammer (2015) indicate that the mean value of 14C/C of ivory samples from 2010 to 2015 is (103 ± 6) pMC. Before the nuclear weapon fallout caused a significant increase of 14C/C in global terrestrial food chains, i.e. before 1956. The value of (98 ± 2) pMC has been found representative based on data of Hua and Barbetti (2004) who analysed wood samples. The value of (97.8 ± 2.0) pMC is regarded as representative as stated in Brunnermeier (2012) who analysed independently dated ivory. Other references like Eisenbud (1987), the UNSCEAR report of 1993 and Lieser (1980) present similar values of 14C/C before 1956. On the other hand, the deviation of their values from the mean value is about ± 10%. Within the scope of uncertainties of the analyses no significant difference between wood and ivory can be observed before 1956.
It has been shown in a recently completed study Schupfner (2016) that nearly 50% of the samples with a PMI < 5 years are below the upper limit of 14C/C, which is representative for wood and ivory before 1954.
The calibration curve of 14C/C which shows the dates of death TD versus 14C/C has been actualised for 1965 ≤ TD ≤ 2015. The question, whether the elephant lived at the south or at the north hemisphere do not cause a significant difference at all TD < 1964 and TD > 1967.
TD is defined as TD =: TA - PMI
where
TA : Date of analysis
PMI: Post mortal interval
The unit of pMC TD(14C/C) is calculated by equation 1 within an interval of 1965 < TD < 2015, determining 14C/C. According to the calibration curves based on data of Brunnermeier (2012), Schupfner (2016), Auerhammer (2015) and Hua and Barbetti (2004), the polynomials of degree 4 or 5 are suggested to determine TD within an interval of 1954 < TD < 2015:
TD (14C/C) = a5 · (14C/C)5 + a4 · (14C/C)4 + a3 · (14C/C)3 + a2 · (14C/C)2 + a2 · (14C/C)2 + a1 · 14C/C + a0
Eq. 1
The coefficients of the polynomial functions a0 to a5 are given in the following table 2.
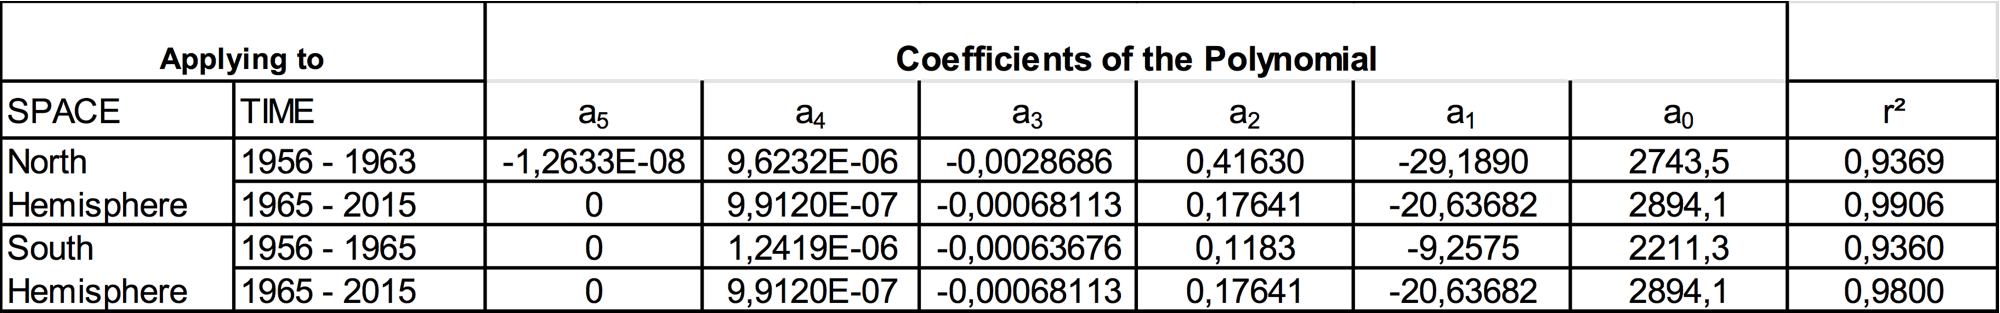
Table 2: Coefficients of the polynomial functions a0 to a5 determining TD (14C/C) within an interval of TD ranging from about 1954 to 2015.
5 PMI: Post Mortal Interval: PMI is the period of time from the time of death of the animal whose ivory is analysed to the time at which the detection started
6 pMC: Percentage Modern Carbon. Unit of specific activity of 14C/C. Definition see Brunnermeier 2012
According to the date of Hua and Barbetti (2004), the distinction between north and south hemisphere is necessary only in a period ranging from about 1963 to 1965. In 1963, the maximum value of 14C/C in wood was reached at about 199 pMC at the north hemisphere whereas in 1965 the maximum value of 14C/C with about 168 pMC was observed at the south hemisphere (see Hua and Barbetti (2004)). Therefore, only the different values of the coefficients a0 to a5 from about 1956 to 1963 are suggested. If it is known, it should also be also taken into consideration whether an analysed ivory sample origins from an elephant living on the southern or the northern hemisphere. Above 1965, a distinction between north and south hemisphere is no longer suggested to be necessary.
4.2 Conditions justifying the determination of 90Sr/Ca and 228Th/232Th
4.2.1 Suggestion to determine 90Sr/Ca
According to data taken from several studies, it is recommended to determine 90Sr/Ca in elephant ivory additional to 14C/C, if the specific activity is equal or lower than 109 pMC. Therefore, it is not possible to distinguish between a time of death before 1958 and those after 2010 with a necessary confidence level. If the value of the specific activity of 90Sr/Ca is significantly above the lower limit of detection of about 0.002 Bq 90Sr/g Ca, the time of death is after 2010 with a confidence level of 95%. If 90Sr/Ca is below 0.002 Bq 90Sr/g Ca, the time of death is before 1956 with a confidence level of 95%.
4.2.2 Suggestion to determine 228Th/232Th
Based on the data taken from several studies, it is suggested to determine 228Th/232Th in elephant ivory additional to 14C/C, if the specific activity is in the range of 109 pMC < 14C/C < 147 pMC. Moreover, the time of death could be above 1.2.1976 and an unambiguous dating is not possible no matter how precise the result is. In this case, the knowledge of the value of 90Sr/Ca does not help to solve the problem because of the similar shapes displayed by the bomb curves of 90Sr/Ca and 14C/C. In contrast to the bomb curves, the thorium calibration curve of PMI (228Th/232Th) (Brunnermeier 2012, Singh 2015) is a continual decreasing function between about 4 years < PMI < about 60 years. Therefore, it is suggested to determine 228Th/232Th, if 14C/C is in the range mentioned above.
4.3 Calculation of the time of death TD(90Sr/Ca)
The trend of 90Sr/Ca of TD > 1965 can be fitted by two different curves. The curves of significantly lower values fit a portion of about 27% of the available data quite well. About 73% of the 90Sr/Ca results with TD > 1965 are fitted much better by the higher curve.
All the analysed ivory included in a recently completed study (Schupfner 2016) is sampled from animals living at the north hemisphere. The (UNSCEAR report of 1993) presents the assessment of the population weighed deposition density of the most important radionuclides from the atmospheric nuclear test explosions on the north and south hemisphere. They state that the deposition of 90Sr was a factor of about 4, which is higher at the north hemisphere than at the southern hemisphere (Eisenbud 1987). Perhaps, this fact declares these relatively high values. The maximum of 90Sr/Ca in bone tissues shown by Eisenbud (2015) and in ivory shown by Schmied (2012) are both from 1965. However, their values differ by a factor of about 25. In ivory, much higher maximum values of 90Sr/Ca are observed than in human bone tissue. Before 1960, there is no difference detectable between human bones tissue and ivory. After 1960 until about 1982 the ratio of 90Sr/Ca in ivory compared to human bone tissue decreases from about 25 to 13 compared with the ivory calibration curve (high). With reference to the calibration curves of Schupfner (2012, 2016), on the basis of the data of Schmied (2012), logarithmic functions are suggested to determine TD within an interval of 1956 < TD < 2015:
TD(90Sr/Ca) = a0 · ln (90Sr/Ca) + t1
Eq. 2
The coefficients are given in the following table 3.
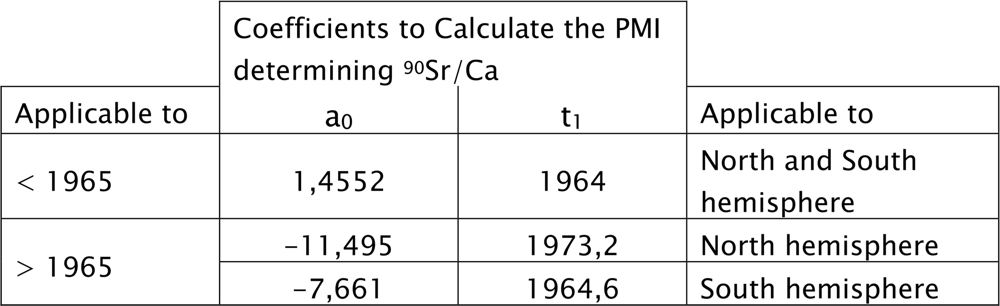
Table 3: Coefficients of the calibration function to determine TD (90Sr/Ca) within an interval of 1956 < TD < 2015.
The values of 90Sr/Ca of the recently analysed samples are significant above the detection limit in ivory of low PMI. In contrast to 14C/C, the following conclusions may be drawn:
If 90Sr/Ca is found above the LLD ≤ 0.002 Bq 90Sr/g Ca in elephant ivory, a PMI corresponding to a date of death TD before 1956 is excluded.
For TD > 1965 two calibration curves describe the behaviour of TD(90Sr/Ca) fairly well. The lower curve calculated with equation 2 (a0 = -7.661 and t1 = 1964.6) describes the values of 90Sr/Ca which are about as factor of 4 to 5 below the upper curve calculated with equation 2 with the a0 = -11.495 and t1 = 1973.2. A reasonable interpretation of the observed difference is the geographic difference of the origin of the ivory samples. It can be assumed that the ivory samples with a low value of 90Sr/Ca are taken from elephants living mainly at the south hemisphere, whereas the high values of 90Sr/Ca are related to elephants living mainly at the north hemisphere. Nevertheless, the analysis of 90Sr/Ca with sufficient low LLD of about 0.002 Bq 90Sr/g Ca can prevent the impending blindness of 14C/C age determination up to about 2045, if the trend of the green calibration curve of figure 2 would continue.
If 90Sr/Ca is found below the LLD ≤ 0.002 Bq 90Sr/g Ca and 14C/C is about 100 pMC in elephant ivory, a PMI corresponding to a date of death TD before 1956 is not excluded, but it cannot be stated that the death had occurred before 1956. Accordingly, it can happen that the elephant lived at the south hemisphere and its value of 90Sr/Ca in ivory is low, according to Schmied (2012). In order to enable a correct calculation of the TD the determination of 228Th/232Th is suggested in such cases.
4.4 Calculation of the time of death TD(228Th/232Th)
Due to the fact that thorium isotopes are naturally occurring radionuclides, the analytical blank has to be corrected carefully. In the following section 4.4.1 it is suggested how this can be done.
4.4.1 Test for thorium contamination applying 230Th as indicator radionuclide
Based on the data of several studies Schupfner (2012, 2016), it can be stated that there is a linear relationship between the activity concentration of a(230Th) and a(232Th) related to ash weight. Expected values of 232Th aexp(232Th) can be calculated from a(230Th) according to the following equation:
aexp(232Th) = c · a(230Th)
Eq. 3
where c is a constant with c ± u(c) = (0.55 ± 0.34)
It is assumed that aexp(232Th) = 0, if a(230Th) = 0. This is an assumption, because on the one hand it is not possible to avoid an analytical blank, on the other hand it cannot be excluded that a sample does not contain any thorium. Before calculating the most probable ratio activity concentration of 228Th/232Th, the following contamination test are performed:
- a) If a(232Th) < 1.1·10-4 Bq 232Th/g aw and
- b) If a(230Th) < 2.1·10-4 Bq 230Th/g aw and
- c) aexp(232Th) is expected to be within a range given by u(c) in equation 3.
Depending on the result of this contamination test the following conclusions are drawn.
7 activity concentration a is calculated as activity in Bq per sample ash weight
No Blank Correction
If no increase of 232Th is observed, i.e. the above statements a) and b) and c) are all true, then the activity ratio of 228Th/232Th is calculated according to the following equation in 4a. This will be derived from the application of the isotope dilution analysis of energy resolved alpha-spectrometry with silicon barrier surface detectors (see section 3.4.2).
The activity concentration of 232Th is given by:
a(232Th) = Atr · Ytr · N(232Th)Y232Th · N(tr) · ma
Eq. 4a
where
tr: radiochemical yield tracer, here 229Th; added to the dissolved sample before beginning with the radiochemical purification procedure.
0.01 Bq < Atr < 0.1 Bq: added amount of activity of the radiochemical yield tracer
Ytr, Y232Th: Emission probability of the alpha-transition for 229Th and 232Th respectively
Ytr = 0.9840 (Bq·s) - 1;(Jain et al. 2009) Y232Th = 1.0000 (Bq·s)-1 (Abasaleem 2014)
N(tr), N(232Th): Number of background corrected counts within the region of interest of the alpha-peak of 229Th and 232Th respectively:
N(x) = N ́(x) – N0(x)
where
- N ́(x): Total number of counts within the alpha-peak of interest
- N0(x): expected number of background counts within the alpha-peak of interest
- x: alpha-peak of interest for 229Th and 232Th respectively
- ma: mass of the sample ash being analysed
In analogy to 232Th the activity concentration of 228Th is given by:
a(228Th) = Atr · Ytr ·N(228Th)Y228Th · N(tr) · ma
Eq. 4b
where
Y228Th = 0.9994 (Bq·s) - 1 (Singh 2015): Emission probability of the alpha-transition for 228Th
N(228Th) = N ́(228Th) – N0(228Th): Number of background corrected counts within the region of interest of the alpha-peak of 228Th.
As shown above a contamination with 232Th is excluded. Therefore, the calculation of the ratio of the activity concentration of 228Th/232Th can be simplified in the following way:
228Th/232Th =: a(228Th)a(232Th) = Ytr · N(228Th) Y228Th · N(tr) · ma Ytr · N(232Th)Y232Th · N(tr) · ma
Eq. 5a
This can be simplified to:
228Th/232Th = Y232Th · N(228Th)Y228Th · N(232Th)
Eq. 5b
This equation results in the most probable value if:
aLLD(232Th) < a(232Th) < amean(232Th) +1.69·SD(232Th)
The ratio 228Th/232Th being calculated according to equation 5b tends to result in slightly too high values than too low values.
If aLLD(232Th) ≥ a(232Th) the magnitude of N(232Th) in equation 5b must be replaced by the number of counts NLLD(232Th), corresponding to the lower limit of detection LLD
NLLD(232Th) = 3 · [(1 + tL,stL0) · N0tL,s(232Th)]1/2
where tL,s, tL0 are the counting time tL (L abbr. for life time) of alpha spectrometry of the sample and the background counting time tL0, respectively. Then:
228Th/232Th ≥ Y232Th · N(228Th)Y228Th · NLLD(232Th)
Eq. 5c
The ratio 228Th/232Th being calculated according to equation 5c tends to result in rather too low than too high values.
Blank Correction
If a significant increase of 232Th is observed according to the criteria in a), b) or c) above, then the activity ratio of 228Th/232Th is calculated according to the following equation taking into consideration a blank correction.
228Th/232Th = a(228Th) - ablank(228Th)a(232Th) - ablank(232Th)
Eq. 6a
Analysing ivory combs made before 1945, the ratio of the analytical blank ablank(228Th) and ablank(232Th) have been found (Schupfner 2012, Brunnermeier 2012) to be
ablank(228Th)ablank(232Th) = 1.19 ± 0.30
Therefore, equation 6a can be simplified to:
228Th/232Th = a(228Th) - 1.19 · ablank(232Th)a(232Th) - ablank(232Th)
Eq. 6b
The ratio 228Th/232Th being calculated according to eq. 6c tends to give slightly too low values than too high ones.
4.4.2 Equations calculating the time of death TD(228Th/232Th)
Applying the actualized calibration curves received on the basis of the data taken from Brunnermeier 2012 and Schupfner 2016, the PMI can be calculated by applying the following equations 7a and b:
The value of PMI in the case of PMI > 4 years is calculated with:
PMI = TD - T0 = c1·ln(228Th/232Th – 1) + c0
Eq. 7a
where
c1= - 8.771 years
c0 = 36.123.
To calculate the value of PMI in the case of PMI ≤ 4 years is calculated with:
PMI = TD - T0 = c2·ln(228Th/232Th – 1)χ
Eq. 7b
where
c2 = 5.866·10-6 years
χ = 3.828
The uncertainty of age determination is about ± 7 years, for values of PMI below 50 years. If the ratios of 228Th/232Th are about 1.2 or below, the uncertainty of age determination increases. In this cases it has to be stated that the PMI is > 50 years.